

We always try to make our product usable and accessible for users. However, it is also essential that our research findings are usable and accessible to all team members in order to be useful and continuously create value.
When almost a large number of research projects are conducted on a product, How to communicate the findings becomes more critical. In this case, we have more data, and our findings are relevant to more people. How to interact with the results of our research so that all people can quickly and easily get answers to their questions about users? In this story, I want to explain how we faced this challenge.
Our organization’s advertising tribe consisted of several cross-functional teams. And we were two researchers working on the advertising panel team. At first, presenting research findings with our small team was easy, but after a few months, the number and scope of our research projects increased. Several product teams and people from marketing, sales, content creators, and operations departments worked on the Bazaar advertising service. They wanted to use the results of the research. Still, the old methods for communicating research findings (such as having people participate in research meetings, presentation meetings, and reports) no longer worked.
We needed to make a change and make our research result accessible to all members who needed it immediately. So we decided to create a knowledge base full of insights and information.
Building Knowledge base
Step 1- What type of information did team members seek to know?
We reviewed all questions people asked us in Slack about the detail of our findings; we also considered what type of questions people asked during the presentation session so that we could understand how they looked for information. Team members usually look for research findings based on the following features:
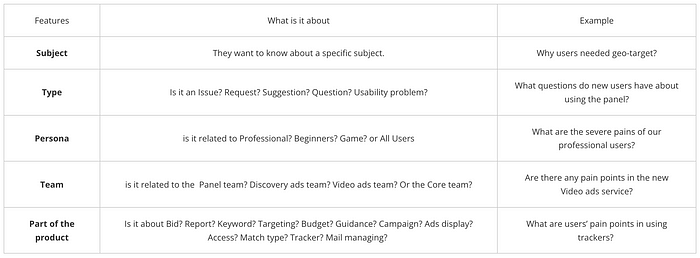
They also need this information to be searchable and provide documentation to assure them of its accuracy.
Step 2 — How did we structure the raw data and build the initial table?
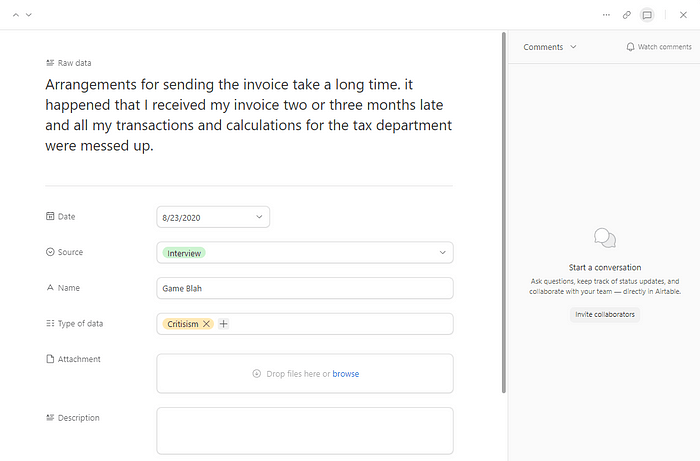
We built a record cart for each piece of raw data in Airtable. The raw data were from all the interviews and tests we had previously entered into Miro and coded or from users’ tickets for the last two months.
Next, we specified the date, data source, user name, and attachments related to each piece of raw data in its card so that it can be cited.
Step 3 — How did we turn the raw data into interpreted and usable findings?
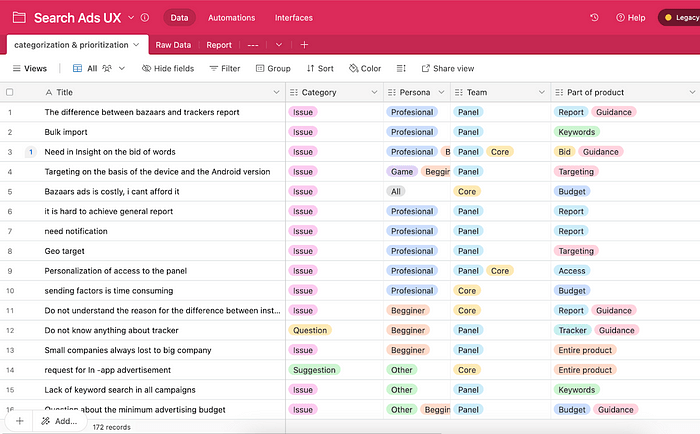
We did a thematic analysis in a separate table and reached specific themes (subjects); next, we linked raw data to their subjects. So we had two tables: raw data and subject title.
We specified the features mentioned above(step 2) for each title as a label so that people could filter each title based on their needs, search for specific words, and see related documents and attachments.
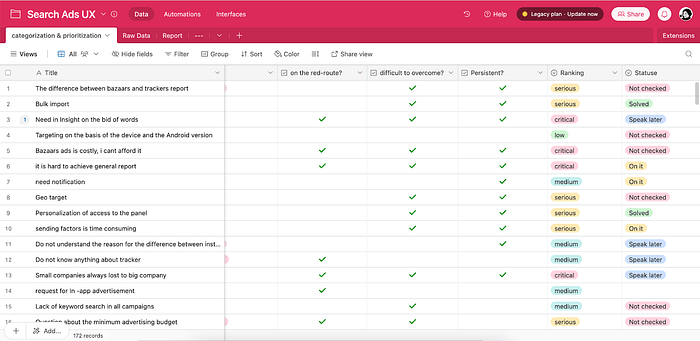
Even when the data was filtered, we needed to prioritize them to determine which should be addressed first. So we used the following method and assigned four columns in the table to it.
Some team members answered the following questions about each record and discussed differences of opinion until they reached an agreement.
- Does it occur on the red route?
- Is it difficult to overcome?
- Is it persistent?
Based on this prioritization, our findings are categorized into four categories: critical, Serious, Medium, and Low.
Step 4- How did we keep it up to date?
We entered all new research data into it. If there were data with a related theme, it would be attached to that title. If not, it will remain in the raw data section until we get similar and related data; then, it will become a new theme.
Also, all new tickets and calls from users were reviewed weekly, and the new insights were entered into the table too.
How did we use this table?
All team members were added to that table. We held meetings to explain to them how this table works and mentioned people related to each title on its card.
We used this table for planning every 2 weeks. We discussed new insights in product meetings, chose which one we should address in that sprint, and put status labels in front of them, clarifying if we were working on it, done, or wanted to work on it later.
It is used for OKR planning too. The product manager defined goals and KPIs; then, we easily filtered the table based on related subjects, parts of the product, and priorities; ultimately, we had a list of needs and issues to work on in the season.
One of the best effects of this knowledge base is that people from other departments, like content creators, support, etc., can use user insights in their everyday job. I remember when a content creator wanted to make an educational article about keywords for newcomers. She filtered records by Part of the product: keyword, type: issue and question, and persona: beginners. She read records, descriptions, and raw data and provided content according to users’ needs.
Final words
This method helped us interact easily with all members of multiple teams when we were overwhelmed with many research findings. I recommend this method if your research findings have increased or the number of people who can use the research in the organization is large. This panel is not going to complicate your work with the process of entering and structuring information. Still, it will make your work easier and help all aspects of the product to work with a user-centered approach. Sometimes, due to the non-user-centered approach of the team members, the type of findings, or problems in the tools, this knowledge base may be useless for your organization and only involve you in the process of entering and categorizing information. So be careful that as long as you build and update this knowledge base, ensure it creates value; otherwise, you must change it or use other methods to communicate your findings.